Duality Dev Update, December 2017
So, this is the first blog entry that I’m writing after switching from Wordpress to Jekyll - less clunky, easier to maintain, static. Besides this little blog update, let’s take a look at what’s been cooking in the Duality game engine over the past months.
There has been a lot of progress in different areas, and while there are many changes that I wanted to include in this update, not all of them made it. If you want to get the full picture of every work item, check out this query on the GitHub project issue tracker, which will list you all the closed issues since the last development update post, sorted in descending order after number of comments to get a rough estimate for their significance.
Progress on v2.x
Let’s start with an update on the currently released 2.x version family. You can see all of the changes below in action with a new Duality install, or after updating your projects packages to the latest version.
Physics Samples
A brand new Physics Sample Package is available for download in the package manager, demonstrating all available shape and joint types, as well as various RigidBody properties and APIs in an interactive sandbox.
This package can serve both as a “getting started” example for new users and a testing environment to reproduce physics bugs for developers - and in fact, it has already helped identify a debug overlay rendering problem and prompted both new features and improvements.
Physics Improvements
As part of this, the restriction on how RigidBody objects interact with Transform hierarchies has been relaxed.
In order to allow physics simulation without interference, parent / child hierarchies of objects were disabled for all RigidBody objects, so moving, rotating or scaling the parent of a simulated object at runtime would not have any effect. However, this prevented the use of child objects as (otherwise passive) collision sensors, since they would not move with their parent anymore.
Addressing this, developers can now specify on a per-object basis whether or not a RigidBody will ignore parent Transform changes.
Another improvement was done on the editor side, rewriting all debug overlays for RigidBody shapes and joints to use a constant line width regardless of camera zoom and remain readable both zoomed in and out. In addition, objects now display both their center of mass and their Transform position, allowing to align them as desired.
Extended RigidBody Shapes
This change was long overdue, and community member @YMRYMR finally kicked things off with the first prototype of an editor feature that allows you to edit the individual vertices of a RigidBody shape. With a bit of a team effort, we polished and merged vertex editing soon after.
As a prerequisite to this, support for non-convex collision shapes has been added as well. Any non-convex shapes will internally run a decomposition algorithm that creates a number of convex polygons to be used for collision detection internally. This can be done both in the editor and at runtime, and the resulting convex polygons are accessible via API, so they can be re-used for rendering and other purposes.
PackageManager Refactoring and Tests
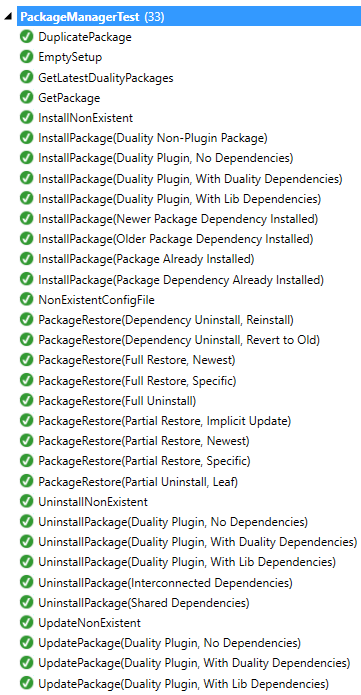
The editors package manager has been restructured from one big class containing most of the implementation into a net of specialized classes which can be maintained and tested individually. Making use of this, about 30 automated tests have been added that check both simple API calls and bigger operations like installing, updating or uninstalling packages with dependency graphs ranging from common to edge cases.
The new tests were immediately put to use in fixing an old package manager bug where conflicting dependency versions could lead to an uninstall / reinstall loop when starting the editor.
TilesetView Zoom
A small but neat improvement to editor usability came from @mfep, who contributed a zoom option to the tileset editor, making it easier to work with very small tilesets.
Progress on v3.0
In the meantime, most of the development efforts have shifted towards the v3.0 milestone, which so far revolves around the three common themes “Cleanup”, “Rendering” and “Performance”. While it doesn’t have a specific release date, we’re well beyond the 50% mark by now and I hope to start wrapping it up for release in the coming months.
To give you a sense of scale, the v3.0 development branch is now about 500 commits ahead of v2.x master, with a total number of 3000 commits in the projects lifetime. At the same time the overall source volume has decreased by 5000 lines, which I think can be taken as a good sign on the cleanup side.
Let’s take a look at some of the changes in detail.
Game View Resolution
The editor now allows you to manually specify rendering resolution in the Game View, making it easier to test your project for different screen and window sizes. It’s one of the changes that would have been a lot of work in v2.x, but thanks to all the rendering improvements and cleanup are now very easy.
Viewport Scaling
In the same vein, it is now possible to specify a fixed virtual viewport size for your game, so that different window and screen sizes all show the exact same view - only with a different rendering resolution. This behaviour is transparent and requires no special handling in game code.
Note that rendering a fixed virtual viewport in a higher resolution will actually make use of that resolution and show finer details that would have been lost otherwise. For retro style games where this is explicitly unwanted, it is also possible to render the game into a fixed-size lowres texture and simply display it on screen.
Benchmarks Sample
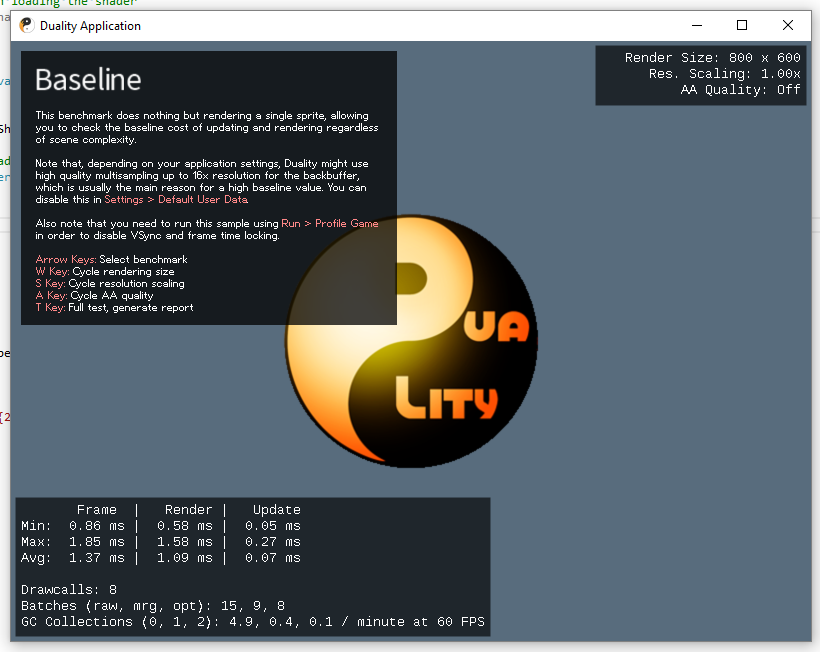
Before proceeding with a lot of internal optimizations, a benchmark was set up and prepared to be released as a sample package, allowing to easily compare performance on different machines and settings. Each test case puts pressure on different parts of the update and render loop, so the most common bottlenecks can be uncovered.
The following test cases have been implemented:
- In the Baseline test, a single sprite is rendered in the center of the screen, along with the shared benchmark UI. The results produced here quantify both the engines “at rest” performance and the overhead introduced by the benchmark itself.
- In the WorldSpritesDummyRenderers test, 10k dummy sprite objects are generated so that 5k are culled and 5k are visible. They behave exactly like regular sprites would, except for the fact that they do not submit any vertices for rendering. This benchmark allows to quantify the impact 10k distinct sprite objects have on the update and render loop regardless of actual vertex counts or materials.
- The WorldSpritesAltMaterials test then builds up on this and uses 10k regular sprites (5k visible, 5k culled) with alternating materials. They are not sorted or otherwise optimized and distributed randomly.
- Targeting batching logic, WorldSpritesSameMaterial has the same 10k (5k / 5k) setup, but all sprites share the same material, theoretically allowing them to be reduced to one drawcall.
- WorldMultiSprites goes one step further and generates only 10 specialized renderers (5 visible, 5 culled), each submitting 1k sprites in a batch. This test can show the impact of few big objects versus many small objects on both update and rendering.
What’s measured during these test cases is both update and render times (min / max / average), as well as garbage collection count (gen0 to gen2).
Disclaimer: If you have a game that actually has 10k distinct sprite objects active at the same time, you might be using the wrong approach. Think particle systems and tilemaps - neither particles nor tiles should be individual objects when you expect a lot of them.
If there’s any object type in your game reaching for the thousands of instances, I strongly recommend a more data oriented array-of-structs approach where you have one manager and / or render Component that takes care of all instances internally. This benchmark does not model expected real-world scenarios - it’s a conscious choice to expose the engine to performance edge cases, to make sure it works well in common cases too.
The first benchmark results were amazingly bad and reinforced the fact that “you can’t optimize what you didn’t profile” in an impressive way. Here’s an excerpt on what they look like prior to all the optimizations that have been done since:
                              Frame  |   Render |   Update
-------------------------------------+------- --+----------
Baseline:                    1.33 ms |  1.05 ms |  0.07 ms
WorldSpritesDummyRenderers:  4.25 ms |  1.26 ms |  2.77 ms
WorldSpritesAltMaterials:   12.99 ms |  9.51 ms |  3.22 ms
WorldSpritesSameMaterial:   10.43 ms |  6.96 ms |  3.24 ms
WorldMultiSprites:           2.01 ms |  1.79 ms |  0.06 ms
Doesn’t look too bad? Let’s take a look at what garbage collection is doing:
GCs per minute at 60 FPS        Gen0  |   Gen1  |   Gen2
--------------------------------------+---------+---------
Baseline:                        48.8 |     0.3 |     0.3
WorldSpritesDummyRenderers:     309.8 |   110.0 |    57.9
WorldSpritesAltMaterials:      1708.0 |   881.8 |    55.6
WorldSpritesSameMaterial:       880.5 |   491.1 |   132.1
WorldMultiSprites:               49.7 |     0.7 |     0.0
Yikes. This is strikingly bad. Granted, most games stay between 1/10 to 1/100 of the test cases object count and will not encounter these numbers, but still - Duality can and should do way better. We’ll take a look at how these results changed in v3.0 later on, but let’s go into more detail on the optimizations themselves first.
Optimized Per-Frame Allocations
First memory profiling results in Visual Studio showed that there was a large number of allocations that were done every frame, only to be discarded by the end of it. This was unacceptable, so I set the goal to get this down to a reasonable range from zero.
Most of these allocations could be avoided by caching and re-using internal objects from last frame and making good use of RawList<T>, as well as avoiding string operations, params arguments in hotpaths and using a zero-allocation merge sort algorithm for sorting vertex batches.
In a second step, Canvas and CanvasBuffer were unified and optimized to avoid allocations while drawing, further reducing memory pressure.
Streamlined Vertex Processing
If you’ve written a custom renderer in Duality before, you might already know that the DrawDevice accepts all the vertices they submit each frame, aggregates them into batches and then hands these batches over to the graphics backend for rendering. This process, however, was far from ideal and probably the main reason for the benchmarks exceeding memory pressure: Not only was it riddled with virtual method calls on a per-submit basis, it also allocated new arrays for vertex storage whenever two batches were merged into one.
In a big rewrite, most of the underlying structures have now been replaced with something more fitting to each task. There are now specialized classes for storing and aggregating vertex data efficiently and instead of allocating and discarding lots of big to small vertex memory slices every frame, there is now one big, re-used buffer for all the vertex data that arrives. A DrawBatch is no longer depending on virtual methods and casts, but a simple container with a few rendering parameters and a memory blob address. For sorting and marging incoming vertices, the DrawDevice now relies on specialized arrays-of-structs that it can process as fast as reasonably possible without entering unsafe territory. And on the backend side, all vertex data can now be uploaded in one big batch, as opposed to one smaller batch per optimized drawcall.
Renderer Culling Optimization
Determining which renderers are currently in view was itself a big virtual back-and-forth chatter between IDrawDevice and ICmpRenderer objects. At least part of this is now history, as culling is now done entirely on the Duality side, with renderer objects only exposing a GetCullingInfo method that is called whenever the system needs it. A big advantage of this is that the returned data is a simple struct, which can be stored, re-used and handed over to a different thread if necessary, as it contains all that is required to decide whether a given renderer is culled or not.
While there were no immediate performance improvements after this change and no multi-threaded approach has been implemented so far, the new design does a much better job in separating renderer implementation from rendering system, and also provides much better optimization opportunities in the future.
Improved Shader Parameter Storage
Optimizing and extending material handling, a specialized data structure for storing shader parameters has been introduced, as well as a way to define parameter values that are shared for all drawcalls of a DrawDevice or Camera.
With the new additions, it is no longer necessary to make copies of shared materials in order to set custom global shader variables. The dynamic lighting sample is one use case where this has an impact, as lighting information can now be easily shared for the entire scene with no costly per-material adjustments to be made.
Vertex Transform Cleanup
Among the most notable changes in how renderers work and vertex data is handled is the vertex transform cleanup. Duality was so far a very typical 2D game engine in the sense that it set up orthographic projection from view space to screen space, but otherwise kept full control on how each vertex was transformed into view space on a case-by-case basis: One sprite might do a parallax effect using its Z position, another might keep in view space and a third might something entirely different.
In practice however, all projection turned out to end up being one of either perspective world space, orthographic world space or orthographic screen space. The added flexibility of manual vertex handling was unused, but paid for in performance and complexity: Every sprite would do its own world-to-view transformation in CPU code and talk to the DrawDevice to find out how exactly to do that. When writing a vertex shader, its vertex input would already be in “projected view space”, requiring reverse engineering to get back to world space.
Starting with v3.0, this has changed. Renderers will now submit all vertices in world space and transformation happens in a new builtin shader function - using just a regular view matrix and an almost regular projection matrix. No more CPU side special cases or calculations, no more smalltalk between renderers and drawing devices, it’s just the standard matrix setup all the way to the bottom now. Of course it is still possible to render in world or screen space, using perspective or orthographic projection, but all of this is now expressed in a matrix setup.
With the former parallax effect now being done as a proper perspective projection, it now works on a per-vertex basis instead of a “per-sprite” basis, complete with proper texture mapping for surfaces that do not align exactly with look direction. And looking at the 2D scene sideways is now as easy as adjusting the view matrix.
 While not officially supported for perspective projection for culling reasons, one way to go from here would be to still use it as an editor debugging device of sorts.
Another possibility would be extending the orthographic projection mode to support tilted camera setups - like the classic retro RPG perspective where you can see both the front and the top of objects, except with proper depth values.
Two things where Duality still deviates from the classic 3D engine matrix stack is the absence of model matrices and the presence of per-vertex depth offset values for sorting. To ease dynamic batching and reduce the number of different required shader parameter configurations, all vertices are submitted in world space directly, rather than object space. Without a different model matrix for every object, it is much easier to combine the vertices from multiple objects into a single batch.
The per-vertex depth offset on the other hand is used for sorting purposes when two sprites should appear exactly equal in perspective projection, but still clearly define which is in front and which is in the back. Depth offsets work exactly like regular Z values, except that they are applied only after the projection. Here’s an example what happens when you use perspective projection and accidentally write into vertex Z, rather than the depth offset:
While technically a (now fixed) bug, still neat to see the potential behind the new setup.
Performance Improvements
So after all these changes, let’s take a look at how performance changed:
                              Frame  |   Render |   Update
-------------------------------------+------- --+----------
Baseline:                    1.39 ms |  1.08 ms |  0.07 ms
WorldSpritesDummyRenderers:  4.39 ms |  0.78 ms |  3.37 ms
WorldSpritesAltMaterials:    8.46 ms |  4.37 ms |  3.85 ms
WorldSpritesSameMaterial:    7.70 ms |  3.79 ms |  3.68 ms
WorldMultiSprites:           1.99 ms |  1.75 ms |  0.06 ms
A lot better already. Might almost double the object count now and still be around 60 FPS. Let’s check out what happened to garbage collection / memory pressure:
GCs per minute at 60 FPS        Gen0  |   Gen1  |   Gen2
--------------------------------------+---------+---------
Baseline:                         4.8 |     0.4 |     0.0
WorldSpritesDummyRenderers:       4.5 |     3.0 |     1.5
WorldSpritesAltMaterials:         5.6 |     2.8 |     2.8
WorldSpritesSameMaterial:         5.1 |     2.6 |     0.0
WorldMultiSprites:                4.6 |     0.7 |     0.0
With the new optimizations, we almost dropped to zero in all cases, with the remaining Gen2 collections likely being caused by switching benchmark test cases and throwing away the previous 10k objects.
Contributors
I also want to use this opportunity for saying thanks to the contributors who joined me in working on Duality since last time:
And of course thanks to everyone who contributed in other ways as well! Every bug report, feature request, tutorial and helpful code snippet is appreciated.
Games
In the meantime, a few game jam entries using Duality were released, and one bigger project was announced. Here’s a quick overview with links to check out.
Rogue4096
A simple but fun roguelike by @mfep made for the lowres game jam, available on itch.io.
Khronos
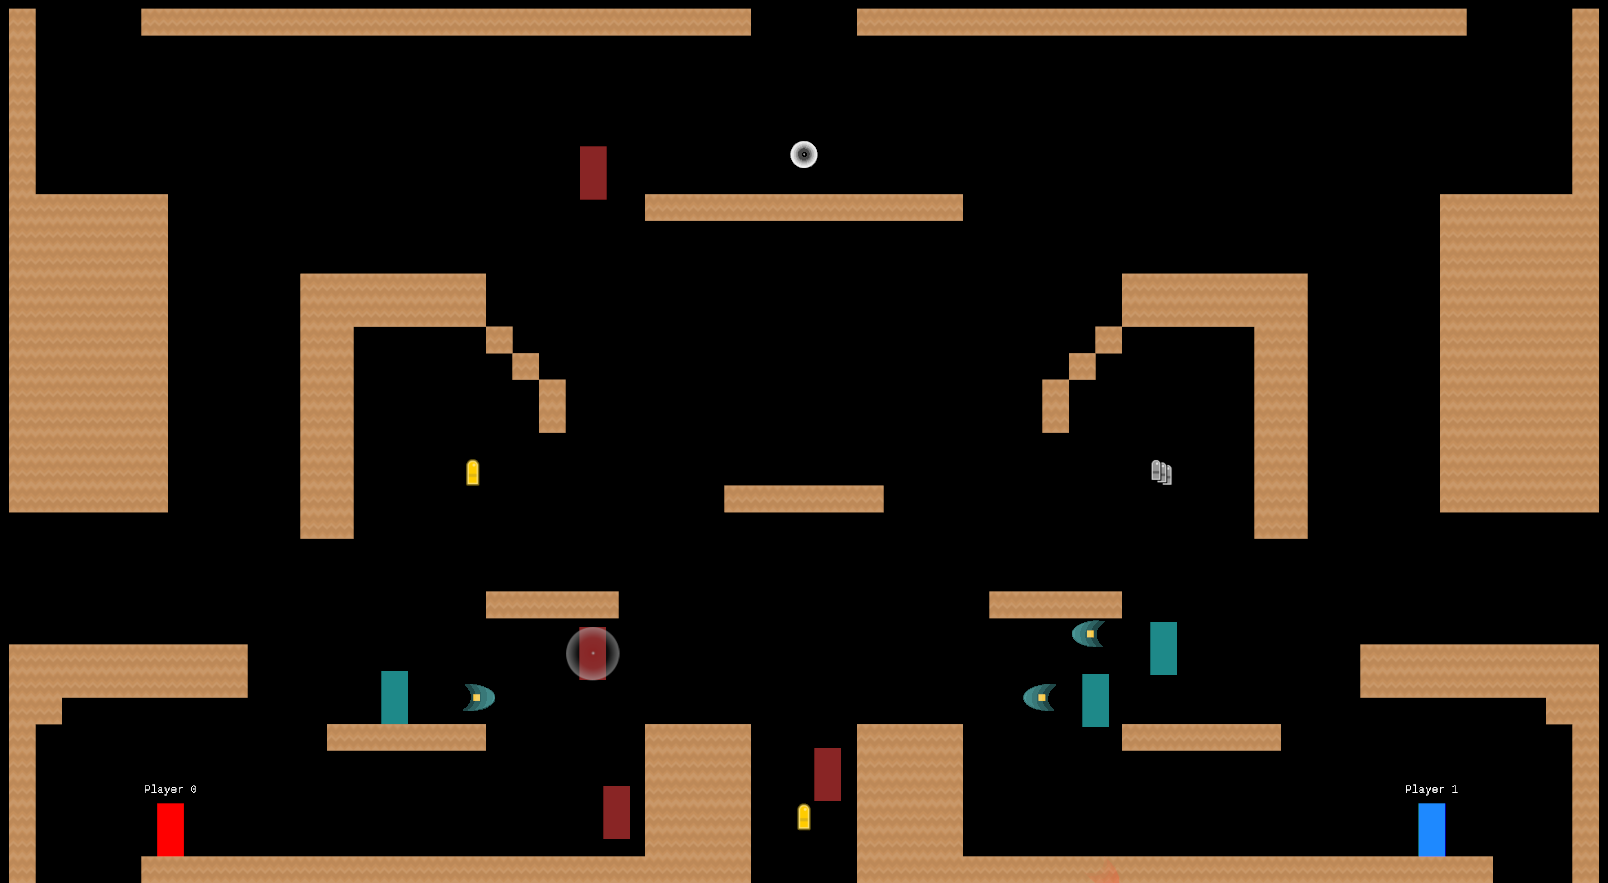 Made for the GitHub Game Off 2017 by Reality.Stop() and ChristianGreiner, Khronos is local multiplayer arcade game that features a time-rewind game mechanic:
This is a local multiplayer arcade action game where each life is etched into the fabric of time, and dying merely causes time to rewind to just before you began. Stack up on time-selves and overwhelm your opponent before you run out of charge!
Unnamed Space Shooter
An unfinished, but fun space shooter I made at a local game jam.
Jazz² Resurrection
An open source implementation of Jazz Jackrabbit 2, built by Dan R. using a custom Duality fork. Runs on Windows, Linux, MacOS and Android, check out this video for a quick impression.
Text and Talk
Besides hands-on development work, there’s also been some news on the text and talk side. The new community blog has been kicked off and is now looking for guest writers to contribute articles and tutorials. Since it’s hosted on GitHub using Jekyll, all it takes is a Pull Request to make changes or add a new blog item.
Meanwhile @gamefromscratch released a new video tutorial on creating a physics platformer in Duality, @ondrejbalas gave a quick intro talk for making a simple game and I made a guest appearance on Channel9 with another Getting Started tutorial.