Debugging comfort
Nobody does as much Duality-related debugging as I do, so I recently explored ways to make this task a little more comfortable. As I discovered, there is more than one way to achieve that.
The easiest one is to take a look at the two debugger attributes DebuggerDisplay and DebuggerBrowsable. The first one allows you to change how a values string representation in the debugger looks like.
By default that string is generated by invoking the objects ToString method, so you’ll be able to change the way your object looks like in the debugger by overriding ToString and implement a custom version.
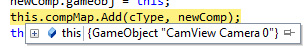
public override string ToString()
{
	return string.Format("GameObject \"{0}\"", this.FullName);
}
This is fine as long as ToString doesn’t really matter to your application and thus can be changed at will. If ToString does affect program behavior (or you simply don’t want to clutter your source code with debug stuff), DebuggerDisplay is your way to go. Its quite easy to use:
[DebuggerDisplay("{Id,nq}, {Name}")]
public class SomeDebugClass
{
	public int Id { get; private set; }
	public string Name { get; private set; }

	// ...
}
The expression in {brackets} is evaluated by the debugger and allows free access to any class member and even method – member accessibility (private, public, …) doesn’t matter here. The comma-separated “nq” tag stands for “no quotes” and does exactly what it sounds like: Remove the quotes that normally encapsulate the expressions result. It is even possible to change how a certain member is named when browsing it in the debugger:
[DebuggerDisplay("{Id,nq}, {Name}")]
public class SomeDebugClass
{
	public int Id { get; private set; }

	[DebuggerDisplay("{Name}", Name="My Name is:")]
	public string Name { get; private set; }

	// ...
}
To be honest, I wouldn’t use that one except for key value pairs maybe, because I imagine it to be really confusing in most other cases.
DebuggerBrowsable allows you to hide or explode certain Fields or Properties completely. By “explode” I mean hiding the member itself while moving all of its child members one level up.
A little less known but equally useful is the DebuggerTypeProxy attribute which can can be used at class level to specify a “replacement class” to use for debugger display.
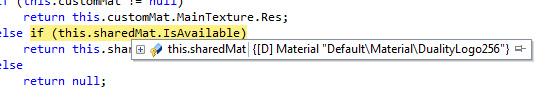
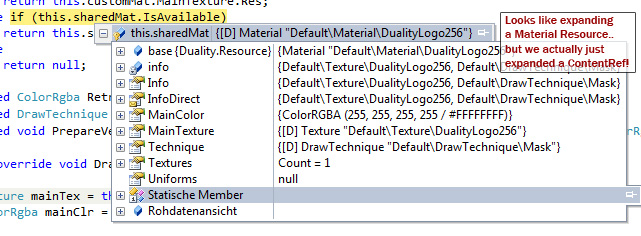
I used that one on Duality’s generic ContentRef struct. It is essentially a lightweight wrapper around Resources to make handling serialization and not-yet-loaded or disposed data a lot easier. While helpful on the framework side, they are mostly annoying on the debugging side because there’s one click more every time you want to expand a Resource. Here’s what I did:
[Serializable]
[DebuggerTypeProxy(typeof(ContentRef<>.DebuggerTypeProxy))]
public struct ContentRef<T> : IEquatable<ContentRef<T>>, IContentRef where T : Resource
{
	[DebuggerBrowsable(DebuggerBrowsableState.Never)]
	public static readonly ContentRef<T> Null = new ContentRef<T>(null);

	[NonSerialized]
	private	T		contentInstance;
	private	string	contentPath;

	public T Res
	{
		get { /* .. */ }
		set { /* .. */ }
	}
	public string Path
	{
		get { /* .. */ }
		set { /* .. */ }
	}

	// ...

	public override string ToString()
	{
		Type resType = this.ResType ?? typeof(Resource);

		char stateChar;
		if (this.IsDefaultContent)
			stateChar = 'D';
		else if (this.IsRuntimeResource)
			stateChar = 'R';
		else if (this.IsExplicitNull)
			stateChar = 'N';
		else if (this.IsLoaded)
			stateChar = 'L';
		else
			stateChar = '_';

		return string.Format("[{2}] {0} \"{1}\"", resType.Name, this.FullName, stateChar);
	}

	// ...

	internal class DebuggerTypeProxy
	{
		private	ContentRef<T>	cr;

		[DebuggerBrowsable(DebuggerBrowsableState.RootHidden)]
		public T Res
		{
			get { return this.cr.Res; }
		}

		public DebuggerTypeProxy(ContentRef<T> cr)
		{
			this.cr = cr;
		}
	}
}
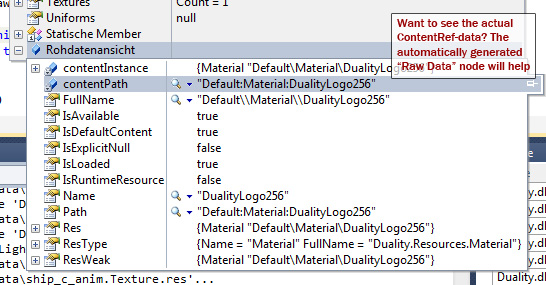
It basically cuts out the one extra click in the debugger and provides some useful value preview via ToString. In a debugging session, there is no difference between expanding a ContentRef and expanding the actual Resource it points to – because that is in almost any case what the programmer wants. And if it isn’t once, he can still expand that automatically created “Raw data” entry.
So that was one tiny bit of debugging comfort. The second one has to do with Debugger Visualizers. Did you ever notice that tiny magnifier icon when viewing a variables value? Clicking it will bring up a new dialog window that visualizes the variables value. The standard visualizers for strings show that value in a multiline textbox or interpreted as an XML or HTML document. And as I learned recently, it is also possible to define your own visualizers. All you need to do is create a new class library project, implement your visualizer there and copy the resulting .dll file into your Visualizers folder (something like “C:\Users\YourUserName\Documents\Visual Studio 2010\Visualizers”). My implementation for Duality Pixmap and Texture Resources looks like this:
// using stuff

[assembly: DebuggerVisualizer(
	typeof(DualityDebugging.BitmapDebuggerVisualizer),
	typeof(DualityDebugging.BitmapDebuggerVisualizerObjectSource),
	Target = typeof(Bitmap),
	Description = "Bitmap Visualizer")]
[assembly: DebuggerVisualizer(
	typeof(DualityDebugging.BitmapDebuggerVisualizer),
	typeof(DualityDebugging.PixmapDebuggerVisualizerObjectSource),
	Target = typeof(Pixmap),
	Description = "Pixmap Visualizer")]
[assembly: DebuggerVisualizer(
	typeof(DualityDebugging.BitmapDebuggerVisualizer),
	typeof(DualityDebugging.TextureDebuggerVisualizerObjectSource),
	Target = typeof(Texture),
	Description = "Texture Visualizer")]

namespace DualityDebugging
{
	public class BitmapDebuggerVisualizerObjectSource : VisualizerObjectSource
	{
		public override void GetData(object target, Stream outgoingData)
		{
			Bitmap bitmap = target as Bitmap;
			BinaryFormatter formatter = new BinaryFormatter();
			formatter.Serialize(outgoingData, string.Format("Bitmap {0}x{1}", bitmap.Width, bitmap.Height));
			formatter.Serialize(outgoingData, bitmap);
			outgoingData.Flush();
		}
	}

	public class TextureDebuggerVisualizerObjectSource : VisualizerObjectSource
	{
		public override void GetData(object target, Stream outgoingData)
		{
			Texture texture = target as Texture;
			BinaryFormatter formatter = new BinaryFormatter();
			formatter.Serialize(outgoingData, texture.ToString());
			formatter.Serialize(outgoingData, texture.RetrievePixelData());
			outgoingData.Flush();
		}
	}

	public class PixmapDebuggerVisualizerObjectSource : VisualizerObjectSource
	{
		public override void GetData(object target, Stream outgoingData)
		{
			Pixmap pixmap = target as Pixmap;
			BinaryFormatter formatter = new BinaryFormatter();
			formatter.Serialize(outgoingData, pixmap.ToString());
			formatter.Serialize(outgoingData, pixmap.PixelData);
			outgoingData.Flush();
		}
	}

	public class BitmapDebuggerVisualizer : DialogDebuggerVisualizer
	{
		protected override void Show(IDialogVisualizerService windowService, IVisualizerObjectProvider objectProvider)
		{
			Stream incomingData = objectProvider.GetData();
			BinaryFormatter formatter = new BinaryFormatter();
			string name = (string)formatter.Deserialize(incomingData);
			Bitmap pixeldata = (Bitmap)formatter.Deserialize(incomingData);
			using (BitmapForm form = new BitmapForm()) {
				form.Text = name;
				form.Bitmap = pixeldata;
				windowService.ShowDialog(form);
			}
		}

		// This isn't needed by Visual Studio, just for testing / debugging purposes:
		public static void TestShow(object objToVisualize)
		{
			if (objToVisualize is Bitmap)
			{
				var visualizerHost = new VisualizerDevelopmentHost(
					objToVisualize,
					typeof(BitmapDebuggerVisualizer),
					typeof(BitmapDebuggerVisualizerObjectSource));
				visualizerHost.ShowVisualizer();
			}
			else if (objToVisualize is Pixmap)
			{
				var visualizerHost = new VisualizerDevelopmentHost(
					objToVisualize,
					typeof(BitmapDebuggerVisualizer),
					typeof(PixmapDebuggerVisualizerObjectSource));
				visualizerHost.ShowVisualizer();
			}
			else if (objToVisualize is Texture)
			{
				var visualizerHost = new VisualizerDevelopmentHost(
					objToVisualize,
					typeof(BitmapDebuggerVisualizer),
					typeof(TextureDebuggerVisualizerObjectSource));
				visualizerHost.ShowVisualizer();
			}
			else
				throw new ArgumentException("Not supported.", "objToVisualize");

		}
	}
}
So now I’m able to do this:
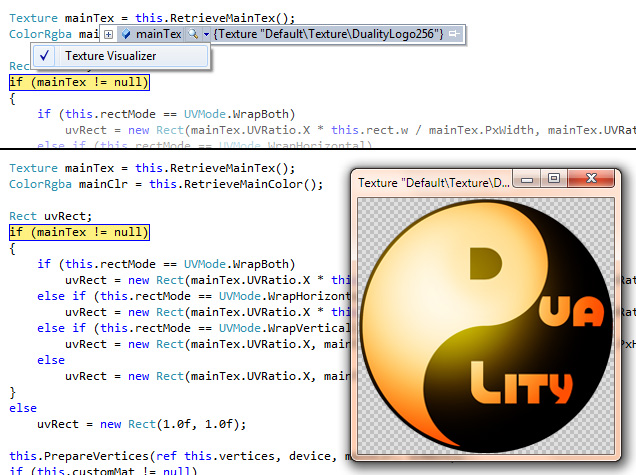
Being able to step through code and view the actual contents of a Texture is worth a lot when trying to figure out why that picking operation (render-to-texture-with-shaders) failed or whether this Texture really has been loaded correctly.